Distributed James Server — Database benchmarks
This document provides basic performance of Distributed James' databases, benchmark methodologies as a basis for a James administrator who can test and evaluate if his Distributed James databases are performing well.
It includes:
-
A sample deployment topology
-
Propose benchmark methodology and base performance for each database. This aims to help operators to quickly identify performance issues and compliance of their databases.
Sample deployment topology
We deploy a sample topology of Distributed James with these following databases:
-
Apache Cassandra 4 as main database: 3 nodes, each node has 8 OVH vCores CPU and 30 GB memory limit (OVH b2-30 instance).
-
OpenDistro 1.13.1 as search engine: 3 nodes, each node has 8 OVH vCores CPU and 30 GB memory limit (OVH b2-30 instance).
-
RabbitMQ 3.8.17 as message queue: 3 Kubernetes pods, each pod has 0.6 OVH vCore CPU and 2 GB memory limit.
-
OVH Swift S3 as an object storage
With the above system, our email service operates stably with valuable performance. For a more details, it can handle a load throughput up to about 1000 JMAP requests per second with 99th percentile latency is 400ms.
Benchmark methodologies and base performances
We are willing to share the benchmark methodologies and the result to you as a reference to evaluate your Distributed James' performance. Other evaluation methods are welcome, as long as your databases exhibit similar or even better performance than ours. It is up to your business needs. If your databases shows results that fall far from our baseline performance, there’s a good chance that there are problems with your system, and you need to check it out thoroughly.
Benchmark Cassandra
Benchmark methodology
Benchmark tool
We use cassandra-stress tool - an official tool of Cassandra for stress loading tests.
The cassandra-stress tool is a Java-based stress testing utility for basic benchmarking and load testing a Cassandra cluster. Data modeling choices can greatly affect application performance. Significant load testing over several trials is the best method for discovering issues with a particular data model. The cassandra-stress tool is an effective tool for populating a cluster and stress testing CQL tables and queries. Use cassandra-stress to:
-
Quickly determine how a schema performs.
-
Understand how your database scales.
-
Optimize your data model and settings.
-
Determine production capacity.
There are several operation types:
-
write-only, read-only, and mixed workloads of standard data
-
write-only and read-only workloads for counter columns
-
user configured workloads, running custom queries on custom schemas
How to benchmark
Here we are using a simple case to test and compare Cassandra performance between different setup environments.
keyspace: stresscql

keyspace_definition: |
  CREATE KEYSPACE stresscql WITH replication = {'class': 'SimpleStrategy', 'replication_factor': 3};

table: mixed_workload

table_definition: |
  CREATE TABLE mixed_workload (
    key uuid PRIMARY KEY,
    a blob,
    b blob
  ) WITH COMPACT STORAGE

columnspec:
  - name: a
    size: uniform(1..10000)
  - name: b
    size: uniform(1..100000)

insert:
  partitions: fixed(1)

queries:
   read:
      cql: select * from mixed_workload where key = ?
      fields: samerow
Create the yaml file as above and copy to a Cassandra node.
Insert some sample data:
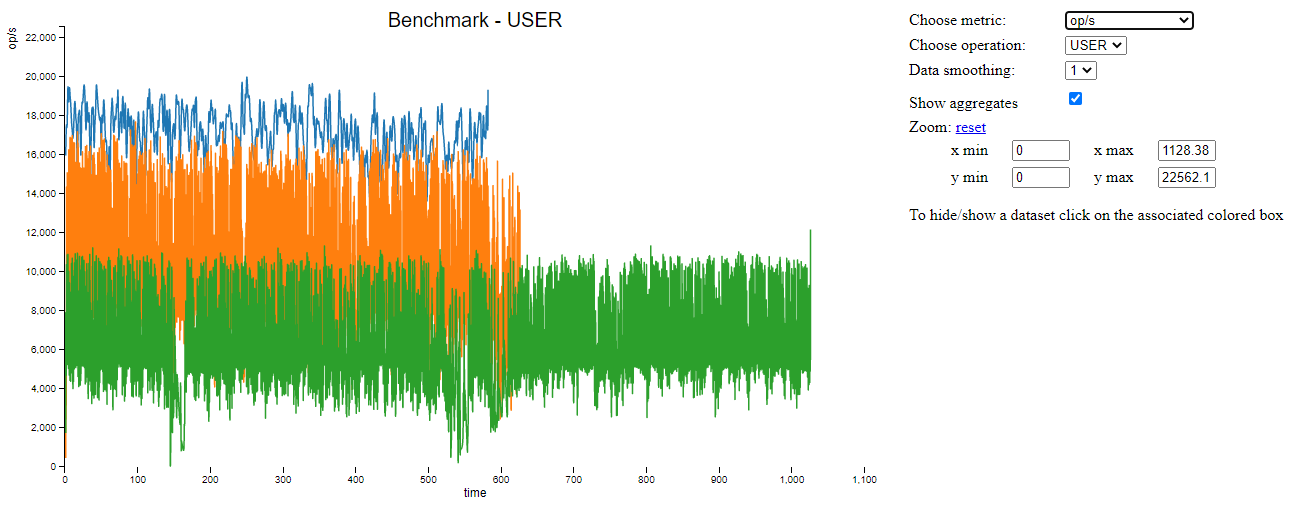
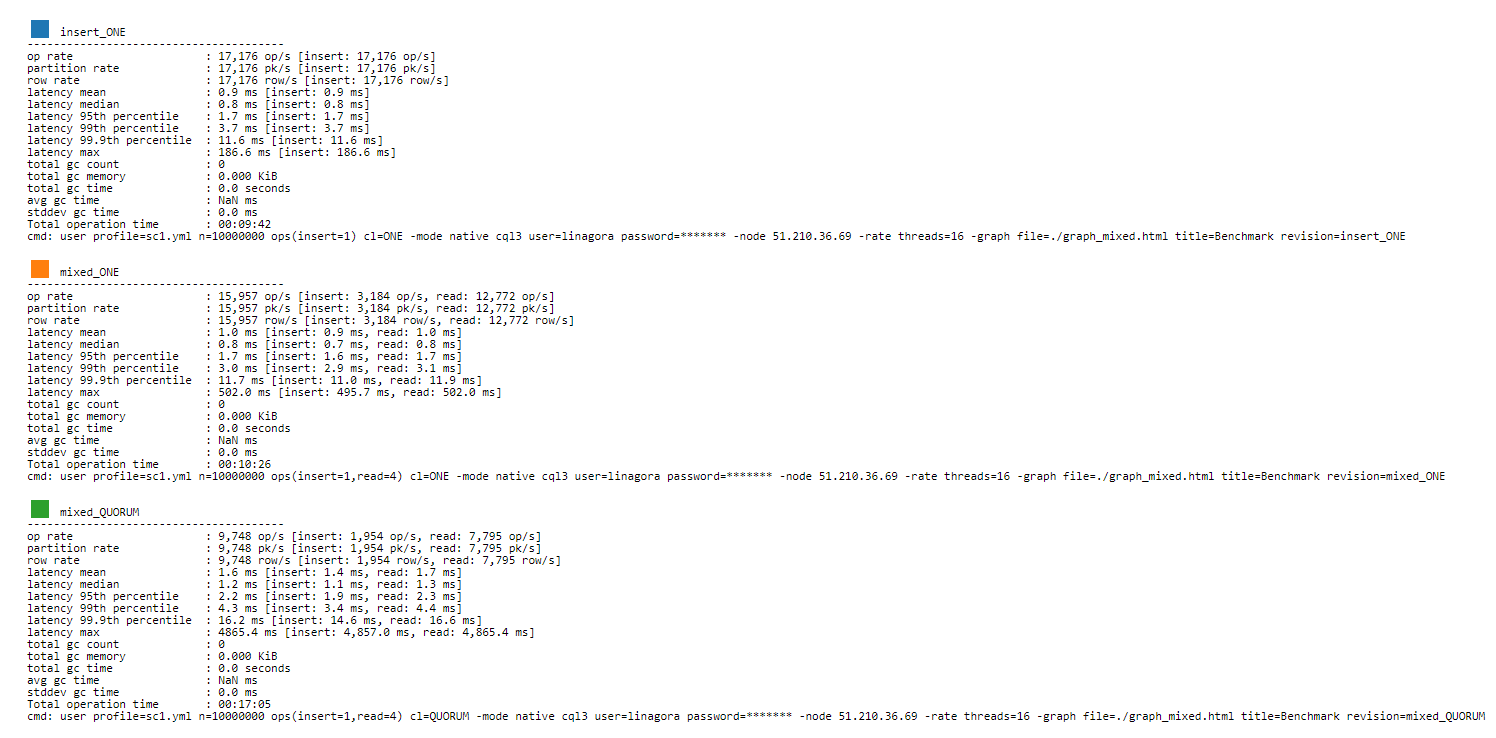
cassandra-stress user profile=mixed_workload.yml n=100000 "ops(insert=1)" cl=ONE -mode native cql3 user=<user> password=<password> -node <IP> -rate threads=8 -graph file=./graph_insert.xml title=Benchmark revision=insert_ONERead intensive scenario:
cassandra-stress user profile=mixed_workload.yml n=100000 "ops(insert=1,read=4)" cl=ONE -mode native cql3 user=<user> password=<password> -node <IP> -rate threads=8 -graph file=./graph_mixed.xml title=Benchmark revision=mixed_ONEIn there:
-
n=100000: The number of insert batches, not number of individual insert operations.
-
rate threads=8: The number of concurrent threads. If not specified it will start with 4 threads and increase until server reaches a limit.
-
ops(insert=1,read=4): This will execute insert and read queries in the ratio 1:4.
-
graph: Export results to graph in html format.
Benchmark OpenSearch
Benchmark methodology
Benchmark tool
We use opensearch-benchmark - an official OpenSearch benchmarking tool. It provides the following features:
-
Automatically create OpenSearch clusters, stress tests them, and delete them.
-
Manage stress testing data and solutions by OpenSearch version.
-
Present stress testing data in a comprehensive way, allowing you to compare and analyze the data of different stress tests and store the data on a particular OpenSearch instance for secondary analysis.
-
Collect Java Virtual Machine (JVM) details, such as memory and garbage collection (GC) data, to locate performance problems.
How to benchmark
To install the opensearch-benchmark tool, you need Python 3.8+ including pip3 first, then run:
python3 -m pip install opensearch-benchmarkIf you have any trouble or need more detailed instructions, please look in the detailed installation guide.
Let’s see which workloads (simulation profiles) that opensearch-benchmark provides: opensearch-benchmark list worloadspmcFull-text benchmark with academic papers from PMC
Run the below script to benchmark against your OpenSearch cluster:
opensearch-benchmark execute_test --pipeline=benchmark-only --workload=[workload-name] --target-host=[ip_node1:port_node1],[ip_node2:port_node2],[ip_node3:port_node3] --client-options="use_ssl:false,verify_certs:false,basic_auth_user:'[user]',basic_auth_password:'[password]'"In there:
-
--pipeline=benchmark-only: benchmark against a running cluster
-
workload-name: the workload you want to benchmark
-
ip:port: OpenSearch Node' socket
-
user/password: OpenSearch authentication credentials
Sample benchmark result
PMC worload
|                                                         Metric |                          Task |       Value |    Unit |
|---------------------------------------------------------------:|------------------------------:|------------:|--------:|
|                                                 Min Throughput |                  index-append |      734.63 |  docs/s |
|                                                Mean Throughput |                  index-append |      763.16 |  docs/s |
|                                              Median Throughput |                  index-append |       746.5 |  docs/s |
|                                                 Max Throughput |                  index-append |      833.51 |  docs/s |
|                                        50th percentile latency |                  index-append |     4738.57 |      ms |
|                                        90th percentile latency |                  index-append |      8129.1 |      ms |
|                                        99th percentile latency |                  index-append |     11734.5 |      ms |
|                                       100th percentile latency |                  index-append |     14662.9 |      ms |
|                                   50th percentile service time |                  index-append |     4738.57 |      ms |
|                                   90th percentile service time |                  index-append |      8129.1 |      ms |
|                                   99th percentile service time |                  index-append |     11734.5 |      ms |
|                                  100th percentile service time |                  index-append |     14662.9 |      ms |
|                                                     error rate |                  index-append |           0 |       % |
|                                                 Min Throughput |                       default |       19.94 |   ops/s |
|                                                Mean Throughput |                       default |       19.95 |   ops/s |
|                                              Median Throughput |                       default |       19.95 |   ops/s |
|                                                 Max Throughput |                       default |       19.96 |   ops/s |
|                                        50th percentile latency |                       default |     23.1322 |      ms |
|                                        90th percentile latency |                       default |     25.4129 |      ms |
|                                        99th percentile latency |                       default |     29.1382 |      ms |
|                                       100th percentile latency |                       default |     29.4762 |      ms |
|                                   50th percentile service time |                       default |     21.4895 |      ms |
|                                   90th percentile service time |                       default |      23.589 |      ms |
|                                   99th percentile service time |                       default |     26.6134 |      ms |
|                                  100th percentile service time |                       default |     27.9068 |      ms |
|                                                     error rate |                       default |           0 |       % |
|                                                 Min Throughput |                          term |       19.93 |   ops/s |
|                                                Mean Throughput |                          term |       19.94 |   ops/s |
|                                              Median Throughput |                          term |       19.94 |   ops/s |
|                                                 Max Throughput |                          term |       19.95 |   ops/s |
|                                        50th percentile latency |                          term |     31.0684 |      ms |
|                                        90th percentile latency |                          term |     34.1419 |      ms |
|                                        99th percentile latency |                          term |     74.7904 |      ms |
|                                       100th percentile latency |                          term |     103.663 |      ms |
|                                   50th percentile service time |                          term |     29.6775 |      ms |
|                                   90th percentile service time |                          term |     32.4288 |      ms |
|                                   99th percentile service time |                          term |      36.013 |      ms |
|                                  100th percentile service time |                          term |     102.193 |      ms |
|                                                     error rate |                          term |           0 |       % |
|                                                 Min Throughput |                        phrase |       19.94 |   ops/s |
|                                                Mean Throughput |                        phrase |       19.95 |   ops/s |
|                                              Median Throughput |                        phrase |       19.95 |   ops/s |
|                                                 Max Throughput |                        phrase |       19.95 |   ops/s |
|                                        50th percentile latency |                        phrase |     23.0255 |      ms |
|                                        90th percentile latency |                        phrase |     26.1607 |      ms |
|                                        99th percentile latency |                        phrase |     31.2094 |      ms |
|                                       100th percentile latency |                        phrase |     45.5012 |      ms |
|                                   50th percentile service time |                        phrase |     21.5109 |      ms |
|                                   90th percentile service time |                        phrase |     24.4144 |      ms |
|                                   99th percentile service time |                        phrase |     26.1865 |      ms |
|                                  100th percentile service time |                        phrase |     43.5122 |      ms |
|                                                     error rate |                        phrase |           0 |       % |

----------------------------------
[INFO] SUCCESS (took 1772 seconds)
----------------------------------References
The opensearch-benchmark tool seems to be a fork of the official benchmark tool EsRally of Elasticsearch.
The opensearch-benchmark tool is not adopted widely yet, so we believe some EsRally references could help as well:
Benchmark RabbitMQ
Benchmark methodology
Benchmark tool
We use rabbitmq-perf-test tool.
How to benchmark
Using PerfTestMulti for more friendly:
-
Provide input scenario from a single file
-
Provide output result as a single file. Can be visualized result file by the chart (graph WebUI)
Run a command like below:
bin/runjava com.rabbitmq.perf.PerfTestMulti [scenario-file] [result-file]In order to visualize result, coping [result-file] to /html/examples/[result-file]
bin/runjava com.rabbitmq.perf.WebServerThen browse: http://localhost:8080/examples/sample.html
Sample benchmark result
-
Scenario file:
[{'name': 'consume', 'type': 'simple',
'uri': 'amqp://james:eeN7Auquaeng@localhost:5677',
'params':
[{'time-limit': 30, 'producer-count': 2, 'consumer-count': 4}]}]-
Result file:
{
  "consume": {
    "send-bytes-rate": 0,
    "recv-msg-rate": 4330.225080385852,
    "avg-latency": 18975254,
    "send-msg-rate": 455161.3183279743,
    "recv-bytes-rate": 0,
    "samples": [{
      "elapsed": 15086,
      "send-bytes-rate": 0,
      "recv-msg-rate": 0,
      "send-msg-rate": 0.06628662335940608,
      "recv-bytes-rate": 0
      },
      {
        "elapsed": 16086,
        "send-bytes-rate": 0,
        "recv-msg-rate": 1579,
        "max-latency": 928296,
        "min-latency": 278765,
        "avg-latency": 725508,
        "send-msg-rate": 388994,
        "recv-bytes-rate": 0
      },
      {
        "elapsed": 48184,
        "send-bytes-rate": 0,
        "recv-msg-rate": 3768.4918347742555,
        "max-latency": 32969370,
        "min-latency": 31852685,
        "avg-latency": 32385432,
        "send-msg-rate": 0,
        "recv-bytes-rate": 0
      },
      {
        "elapsed": 49186,
        "send-bytes-rate": 0,
        "recv-msg-rate": 4416.167664670658,
        "max-latency": 33953465,
        "min-latency": 32854771,
        "avg-latency": 33373113,
        "send-msg-rate": 0,
        "recv-bytes-rate": 0
      }]
  }
}-
Key result points:
| Metrics | Unit | Result |
|---|---|---|
Publisher throughput (the sending rate) |
messages / second |
3111 |
Consumer throughput (the receiving rate) |
messages / second |
4404 |
Benchmark S3 storage
Benchmark methodology
Benchmark tool
We use s3-benchmark tool.
How to benchmark
-
Make sure you set up appropriate S3 credentials with
awscli. -
If you are using a compatible S3 storage of cloud providers like OVH, you would need to configure
awscli-plugin-endpoint. E.g: Getting started with the OVH Swift S3 API -
Install
s3-benchmarktool and run the command:
./s3-benchmark -endpoint=[endpoint] -region=[region] -bucket-name=[bucket-name] -payloads-min=[payload-min] -payloads-max=[payload-max] threads-max=[threads-max]Sample benchmark result
We did S3 performance testing with suitable email objects sizes: 4 KB, 128 KB, 1 MB, 8 MB.
Result:
--- SETUP --------------------------------------------------------------------------------------------------------------------

Uploading 4 KB objects
 100% |████████████████████████████████████████|  [4s:0s]
Uploading 128 KB objects
 100% |████████████████████████████████████████|  [9s:0s]
Uploading 1 MB objects
 100% |████████████████████████████████████████|  [8s:0s]
Uploading 8 MB objects
 100% |████████████████████████████████████████|  [10s:0s]

--- BENCHMARK ----------------------------------------------------------------------------------------------------------------

Download performance with 4 KB objects (b2-30)
                           +-------------------------------------------------------------------------------------------------+
                           |            Time to First Byte (ms)             |            Time to Last Byte (ms)              |
+---------+----------------+------------------------------------------------+------------------------------------------------+
| Threads |     Throughput |  avg   min   p25   p50   p75   p90   p99   max |  avg   min   p25   p50   p75   p90   p99   max |
+---------+----------------+------------------------------------------------+------------------------------------------------+
|       8 |       0.6 MB/s |   36    10    17    22    36    57   233   249 |   37    10    17    22    36    57   233   249 |
|       9 |       0.6 MB/s |   30    10    15    21    33    45    82   234 |   30    10    15    21    33    45    83   235 |
|      10 |       0.2 MB/s |   55    11    18    22    28    52   248  1075 |   55    11    18    22    28    52   249  1075 |
|      11 |       0.3 MB/s |   66    11    18    23    45   233   293   683 |   67    11    19    23    45   233   293   683 |
|      12 |       0.6 MB/s |   35    12    19    22    43    55    67   235 |   35    12    19    22    43    56    67   235 |
|      13 |       0.2 MB/s |   68    11    19    26    58    79   279  1037 |   68    11    19    26    58    80   279  1037 |
|      14 |       0.6 MB/s |   43    17    20    24    52    56   230   236 |   43    17    20    25    52    56   230   236 |
|      15 |       0.2 MB/s |   69    11    16    23    50    66   274  1299 |   69    11    16    24    50    66   274  1299 |
|      16 |       0.5 MB/s |   52     9    19    31    81    95   228   237 |   53     9    19    31    81    95   229   237 |
+---------+----------------+------------------------------------------------+------------------------------------------------+

Download performance with 128 KB objects (b2-30)
                           +-------------------------------------------------------------------------------------------------+
                           |            Time to First Byte (ms)             |            Time to Last Byte (ms)              |
+---------+----------------+------------------------------------------------+------------------------------------------------+
| Threads |     Throughput |  avg   min   p25   p50   p75   p90   p99   max |  avg   min   p25   p50   p75   p90   p99   max |
+---------+----------------+------------------------------------------------+------------------------------------------------+
|       8 |       3.3 MB/s |   71    16    22    28    39    66   232  1768 |   73    16    23    29    43    67   233  1769 |
|       9 |       3.6 MB/s |   74     9    19    23    34    58   239  1646 |   75    10    20    24    37    59   240  1647 |
|      10 |       2.9 MB/s |   97    16    21    24    48    89   656  2034 |   99    17    21    26    49    92   657  2035 |
|      11 |       3.0 MB/s |  100    10    21    26    39    64  1049  2029 |  101    11    21    27    40    65  1050  2030 |
|      12 |       3.0 MB/s |   76    12    19    24    44    56   256  2012 |   77    13    20    25    48    69   258  2013 |
|      13 |       6.1 MB/s |   73    10    13    20    43   223   505  1026 |   74    10    15    21    43   224   506  1027 |
|      14 |       5.5 MB/s |   81    11    15    23    51   240   666  1060 |   82    12    16    23    54   241   667  1060 |
|      15 |       2.7 MB/s |   80    10    19    28    43    59   234  2222 |   84    11    25    34    47    60   236  2224 |
|      16 |      18.6 MB/s |   58    10    19    26    61   224   248   266 |   61    10    22    29    65   224   249   267 |
+---------+----------------+------------------------------------------------+------------------------------------------------+

Download performance with 1 MB objects (b2-30)
                           +-------------------------------------------------------------------------------------------------+
                           |            Time to First Byte (ms)             |            Time to Last Byte (ms)              |
+---------+----------------+------------------------------------------------+------------------------------------------------+
| Threads |     Throughput |  avg   min   p25   p50   p75   p90   p99   max |  avg   min   p25   p50   p75   p90   p99   max |
+---------+----------------+------------------------------------------------+------------------------------------------------+
|       8 |      56.4 MB/s |   41    12    26    34    43    57    94   235 |  136    30    69   100   161   284   345   396 |
|       9 |      55.2 MB/s |   53    19    32    39    50    69   238   247 |  149    26    84   117   164   245   324   655 |
|      10 |      33.9 MB/s |   74    17    27    37    50    77   456  1060 |  177    29    97   134   205   273   484  1076 |
|      11 |      57.3 MB/s |   56    26    35    44    57    71   251   298 |  185    40    93   129   216   329   546   871 |
|      12 |      37.7 MB/s |   66    21    33    43    58    73   102  1024 |  202    24    81   125   205   427   839  1222 |
|      13 |      57.6 MB/s |   59    24    35    40    58    71   275   289 |  215    40    94   181   288   393   500   674 |
|      14 |      47.1 MB/s |   73    18    46    56    66    75   475   519 |  229    30   116   221   272   441   603   686 |
|      15 |      58.2 MB/s |   65    11    40    51    63    75   260   294 |  243    29   132   174   265   485   831   849 |
|      16 |      23.1 MB/s |   96    14    46    55    62    80   124  2022 |  278    31   124   187   249   634   827  2028 |
+---------+----------------+------------------------------------------------+------------------------------------------------+

Download performance with 8 MB objects (b2-30)
                           +-------------------------------------------------------------------------------------------------+
                           |            Time to First Byte (ms)             |            Time to Last Byte (ms)              |
+---------+----------------+------------------------------------------------+------------------------------------------------+
| Threads |     Throughput |  avg   min   p25   p50   p75   p90   p99   max |  avg   min   p25   p50   p75   p90   p99   max |
+---------+----------------+------------------------------------------------+------------------------------------------------+
|       8 |      58.4 MB/s |   88    35    65    79    88    96   288   307 | 1063   458   564   759   928  1151  4967  6841 |
|       9 |      50.4 MB/s |  137    32    52    69   145   286   509  1404 | 1212   160   471   581  1720  2873  3744  4871 |
|      10 |      58.2 MB/s |   77    46    54    66    77    98   275   285 | 1319   377   432   962  1264  3232  4266  6151 |
|      11 |      58.4 MB/s |   97    32    63    72    80    91   323   707 | 1429   325   593   722  1648  3020  6172  6370 |
|      12 |      58.5 MB/s |  108    26    65    81    91   261   301   519 | 1569   472   696  1101  1915  3175  4066  5110 |
|      13 |      56.1 MB/s |  115    35    69    83    93   125   329  1092 | 1712   458   801  1165  2354  3559  3865  5945 |
|      14 |      58.6 MB/s |  103    26    70    78    88   112   309   656 | 1807   789   999  1269  1998  3258  5201  6651 |
|      15 |      58.3 MB/s |  113    31    55    67    79   134   276  1490 | 1947   497  1081  1756  2730  3557  3799  3974 |
|      16 |      58.0 MB/s |   99    35    67    79    96   146   282   513 | 2091   531   882  1136  2161  6034  6686  6702 |
+---------+----------------+------------------------------------------------+------------------------------------------------+
We believe that the actual OVH Swift S3' throughput should be at least about 100 MB/s. This was not fully achieved due to network limitations of the client machine performing the benchmark.