Distributed James Server — Metrics
James relies on the Dropwizard metric library for keeping track of some core metrics of James.
Such metrics are made available via JMX. You can connect for instance using VisualVM and the associated mbean plugins.
We also support displaying them via Grafana. Two methods can be used to back grafana display:
-
Prometheus metric collection - Data are exposed on a HTTP endpoint for Prometheus scrape.
-
ElasticSearch metric collection - This method is depreciated and will be removed in next version.
Expose metrics for Prometheus collection
To enable James metrics, add extensions.routes to webadmin.properties file:
extensions.routes=org.apache.james.webadmin.dropwizard.MetricsRoutesConnect to james-admin url to test the result:
http://james-admin-url/metrics
Configure Prometheus Data source
You need to set up Prometheus first to scrape James metrics.
Add Apache James WebAdmin Url or IP address to prometheus.yaml configuration file:
scrape_configs:
  # The job name is added as a label `job=<job_name>` to any timeseries scraped from this config.
  - job_name: 'WebAdmin url Example'
    scrape_interval: 5s
    metrics_path: /metrics
    static_configs:
      - targets: ['james-webamin-url']
  - job_name: 'WebAdmin IP Example'
    scrape_interval: 5s
    metrics_path: /metrics
    static_configs:
      - targets: ['192.168.100.10:8000']
Connect Prometheus to Grafana
You can do this either from Grafana UI or from a configuration file.
The following docker-compose.yaml will help you install a simple Prometheus/ Grafana stack :
version: '3'
#Metric monitoring
  grafana:
    image: grafana/grafana:latest
    container_name: grafana
    ports:
      - "3000:3000"

  prometheus:
    image: prom/prometheus:latest
    restart: unless-stopped
    ports:
      - "9090:9090"
    volumes:
      - ./conf/prometheus.yml:/etc/prometheus/prometheus.yml
Getting dashboards
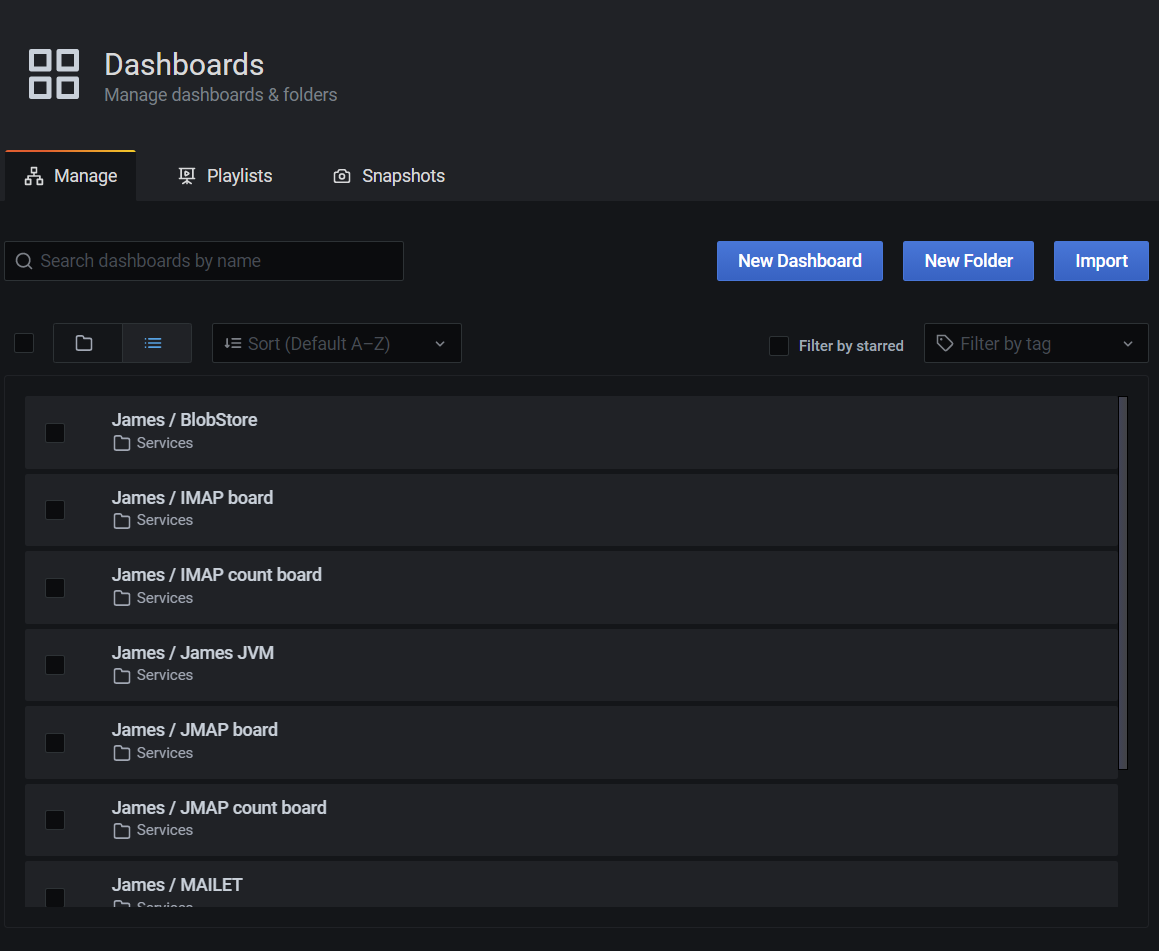
Now that the Promtheus/Grafana servers are up, go to this link to get all dashboards JSON file. Import the different JSON files in this directory to Grafana via UI.
*Note: For communication between multiple docker-compose projects, see here for example. An easier approach is to merge James and Metric docker-compose files together.
Available metrics
Here are the available metrics :
-
James JVM metrics
-
Number of active SMTP connections
-
Number of SMTP commands received
-
Number of active IMAP connections
-
Number of IMAP commands received
-
Number of active LMTP connections
-
Number of LMTP commands received
-
Number of per queue number of enqueued mails
-
Number of sent emails
-
Number of delivered emails
-
Diverse Response time percentiles, counts and rates for JMAP
-
Diverse Response time percentiles, counts and rates for IMAP
-
Diverse Response time percentiles, counts and rates for SMTP
-
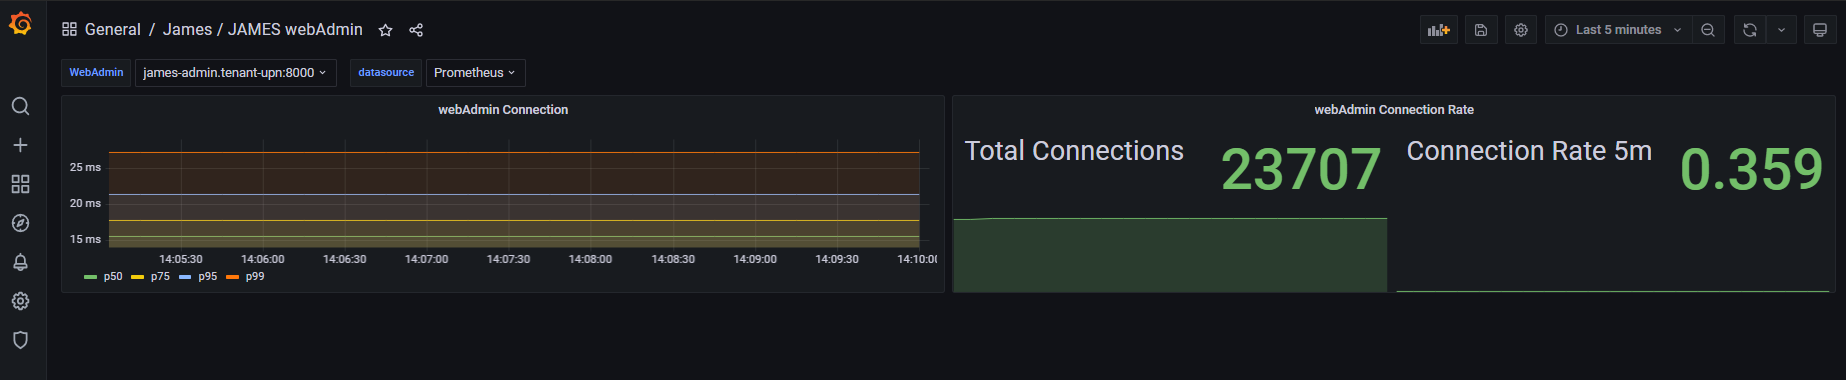
Diverse Response time percentiles, counts and rates for WebAdmin
-
Diverse Response time percentiles, counts and rates for each Mail Queue
-
Per mailet and per matcher Response time percentiles
-
Diverse Response time percentiles, counts and rates for DNS
-
Cassandra Java driver metrics
-
Tika HTTP client statistics
-
SpamAssassin TCP client statistics
-
Mailbox listeners statistics time percentiles
-
Mailbox listeners statistics requests rate
-
Pre-deletion hooks execution statistics time percentiles
Available Grafana boards
Here are the various relevant Grafana boards for the Distributed Server:
-
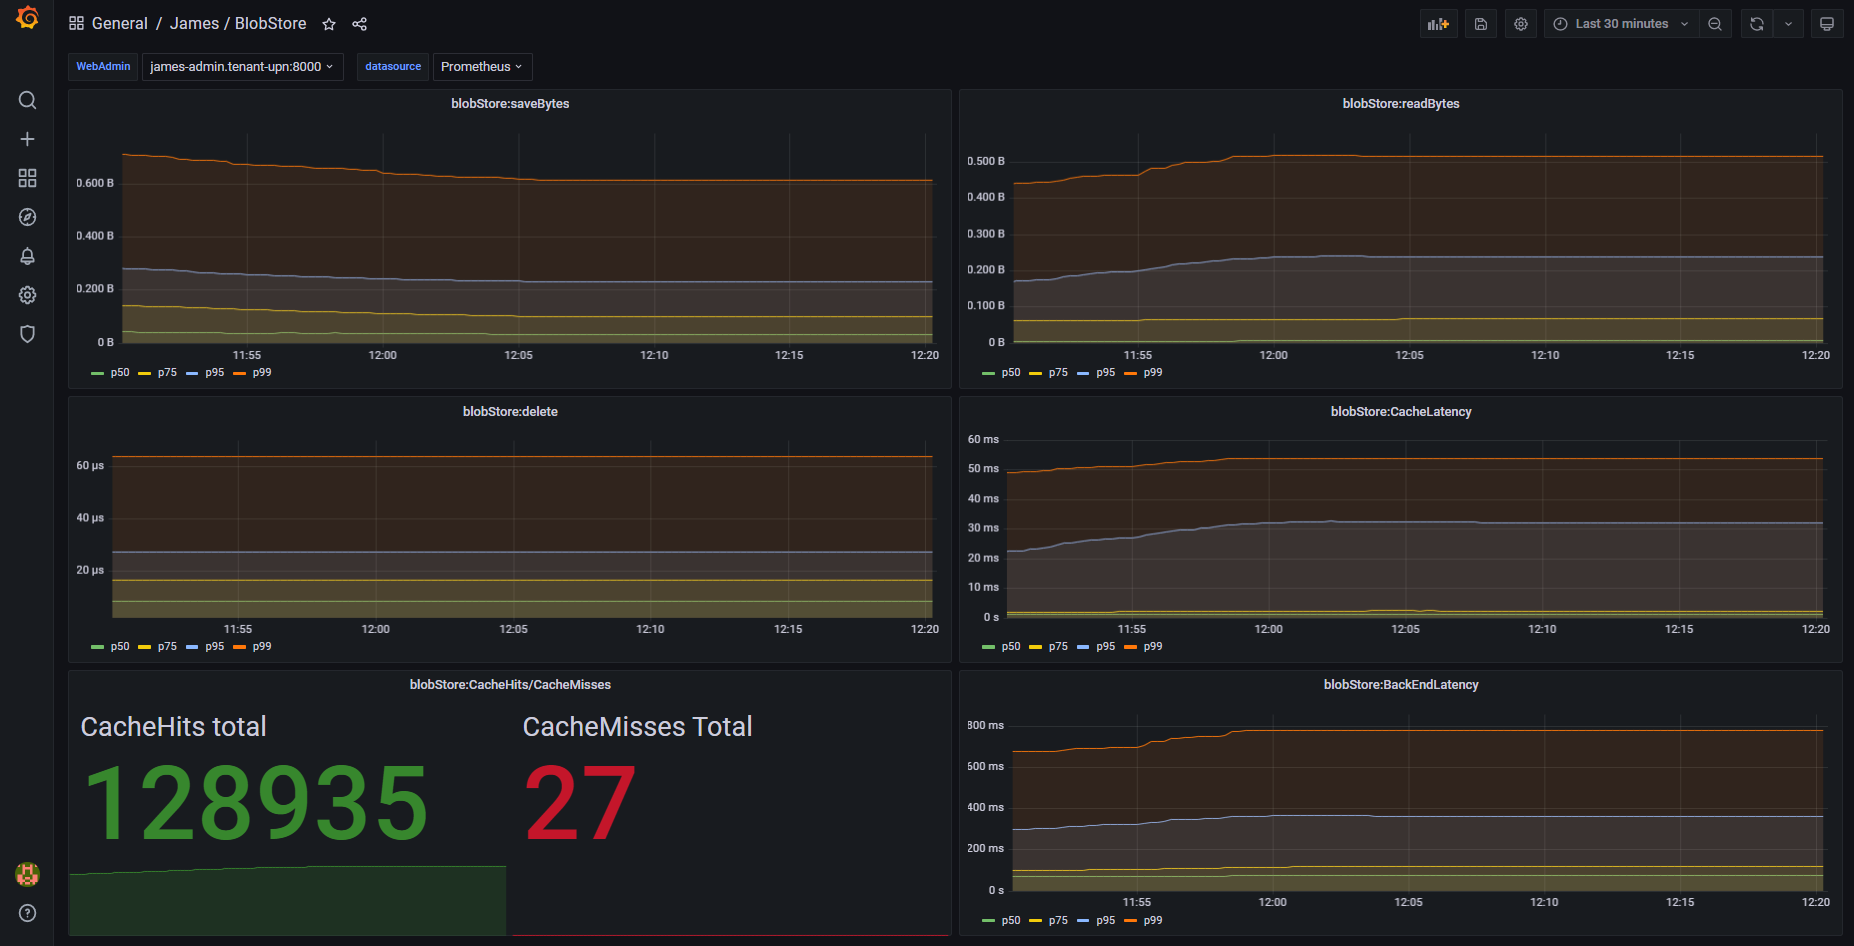
BlobStore : Rates and percentiles for the BlobStore component
-
DNS : Latencies and query counts for DNS resolution.
-
IMAP : Latencies for the IMAP protocol
-
IMAP counts : Request counts for the IMAP protocol
-
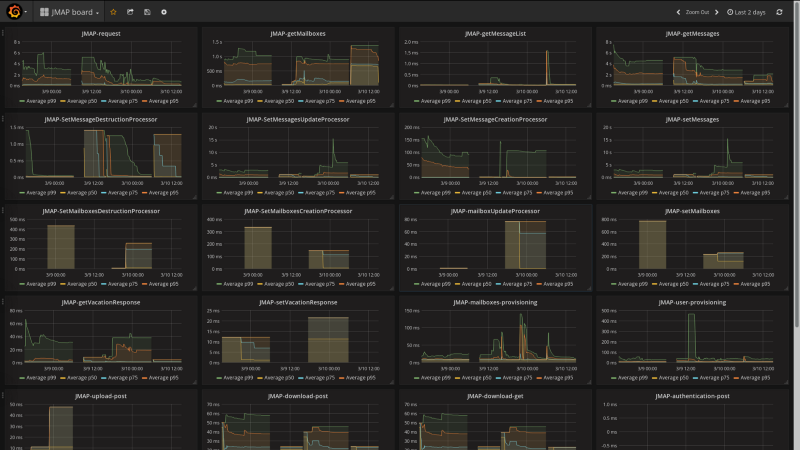
JMAP : Latencies for the JMAP protocol
-
JMAP counts : Request counts for the JMAP protocol
-
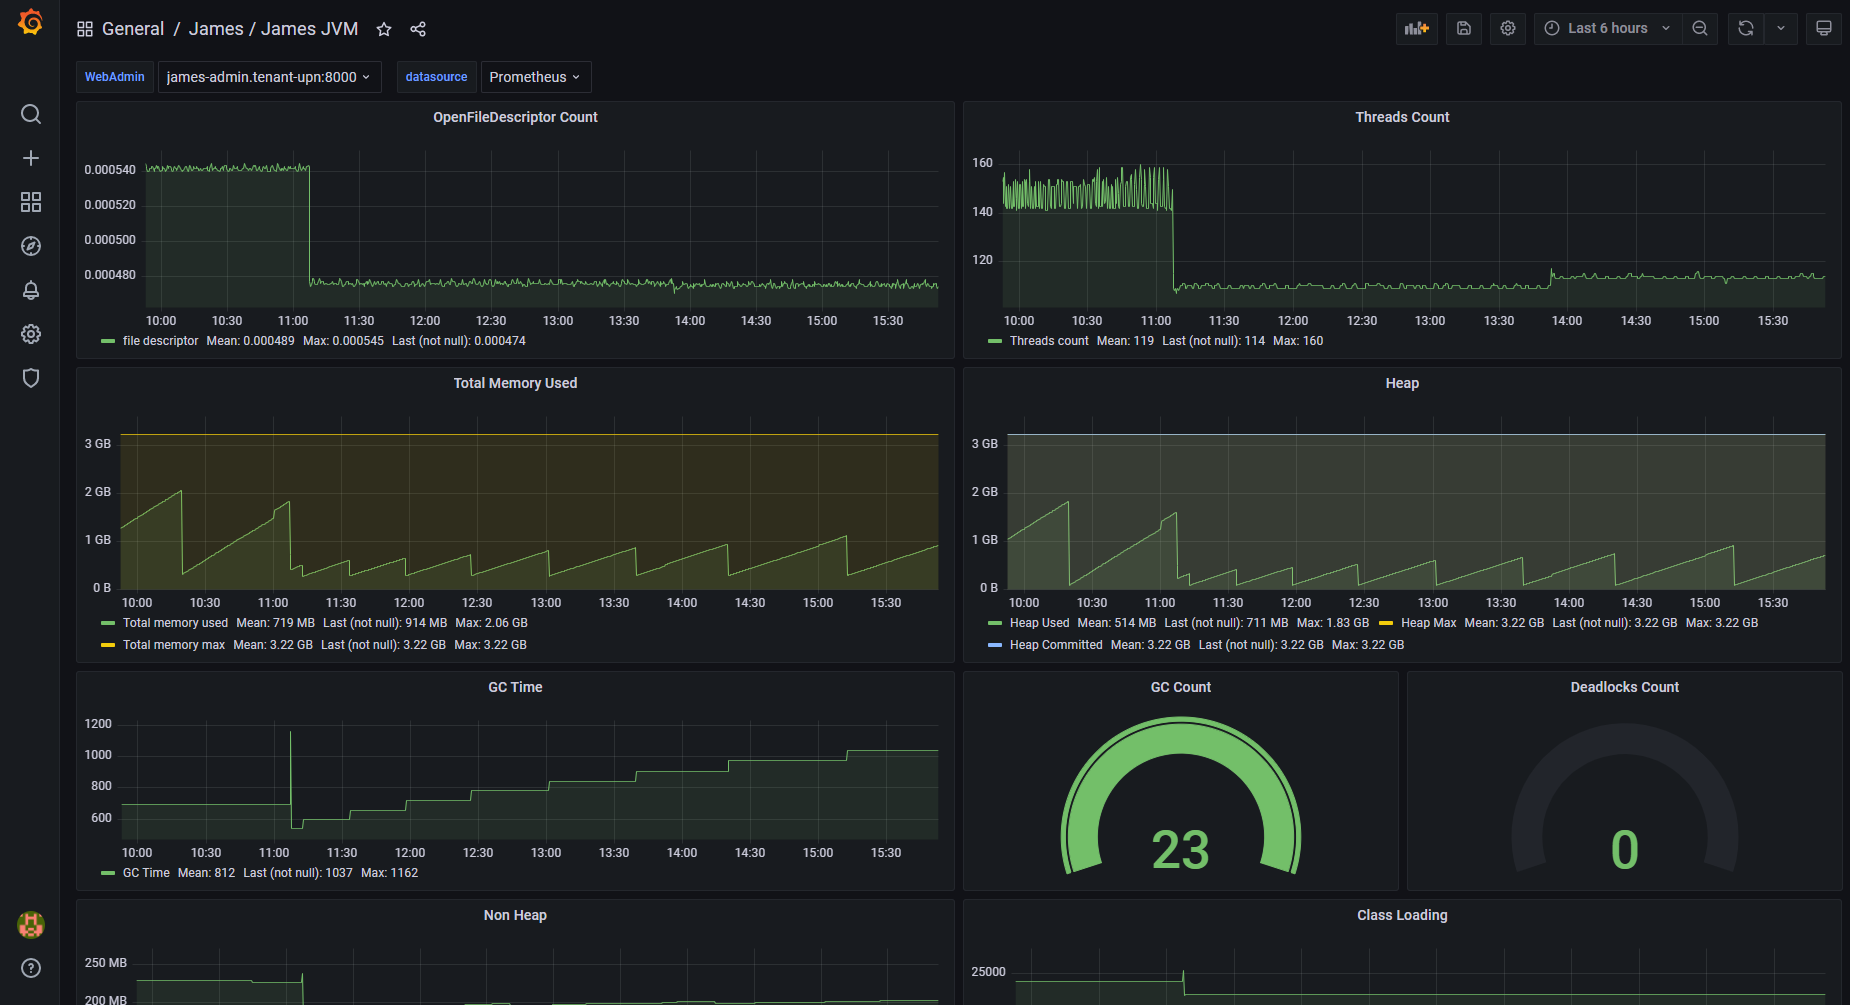
JVM : JVM statistics (heap, gcs, etc…)
-
Mailets : Per-mailet execution timings.
-
Matchers : Per-matcher execution timings
-
MailQueue : MailQueue statistics
-
SMTP : SMTP latencies reports
-
SMTP count : Request count for the SMTP protocol

Expose metrics for Elasticsearch collection
The following command allow you to run a fresh grafana server :
docker run -i -p 3000:3000 grafana/grafana
Once running, you need to set up an ElasticSearch data-source : - select proxy mode - Select version 2.x of ElasticSearch - make the URL point your ES node - Specify the index name. By default, it should be :
[james-metrics-]YYYY-MM
Import the different dashboards you want.
You then need to enable reporting through ElasticSearch. Modify your James ElasticSearch configuration file accordingly. To help you doing this, you can take a look to elasticsearch.properties.
If some metrics seem abnormally slow despite in depth database performance tuning, feedback is appreciated as well on the bug tracker, the user mailing list or our Gitter channel (see our community page) . Any additional details categorizing the slowness are appreciated as well (details of the slow requests for instance).