Distributed James Server — Metrics
James relies on the Dropwizard metric library for keeping track of some core metrics of James.
Such metrics are made available via JMX. You can connect for instance using VisualVM and the associated mbean plugins.
You can also export the metrics to ElasticSearch and visualize them with Grafana. See elaticseach.properties documentation for more details on how to set this up.
If some metrics seem abnormally slow despite in depth database performance tuning, feedback is appreciated as well on the bug tracker, the user mailing list or our Gitter channel (see our community page) . Any additional details categorizing the slowness are appreciated as well (details of the slow requests for instance).
Available metrics
Here are the available metrics :
-
James JVM metrics
-
Number of active SMTP connections
-
Number of SMTP commands received
-
Number of active IMAP connections
-
Number of IMAP commands received
-
Number of active LMTP connections
-
Number of LMTP commands received
-
Number of per queue number of enqueued mails
-
Number of sent emails
-
Number of delivered emails
-
Diverse Response time percentiles, counts and rates for JMAP
-
Diverse Response time percentiles, counts and rates for IMAP
-
Diverse Response time percentiles, counts and rates for SMTP
-
Diverse Response time percentiles, counts and rates for WebAdmin
-
Diverse Response time percentiles, counts and rates for each Mail Queue
-
Per mailet and per matcher Response time percentiles
-
Diverse Response time percentiles, counts and rates for DNS
-
Cassandra Java driver metrics
-
Tika HTTP client statistics
-
SpamAssassin TCP client statistics
-
Mailbox listeners statistics time percentiles
-
Mailbox listeners statistics requests rate
-
Pre-deletion hooks execution statistics time percentiles
Available Grafana boards
Here are the various relevant Grafana boards for the Distributed Server:
-
BlobStore : Rates and percentiles for the BlobStore component
-
BlobStore Cache : Hit ratios and percentiles for the BlobStore Cache component. Note that this is relevant if this component is configured.
-
Cassandra driver : Exposes some dashboard for the merics collected by the Cassandra driver, like request counts, and percentiles.
-
Deleted Message Vault : Exposes metrics for the deleted message vault. Note that this is relevant if this component is configured.
-
DNS : Latencies and query counts for DNS resolution.
-
IMAP : Latencies for the IMAP protocol
-
IMAP counts : Request counts for the IMAP protocol
-
JVM : JVM statistics (heap, gcs, etc…)
-
Mailets : Per-mailet execution timings.
-
Matchers : Per-matcher execution timings -https://github.com/apache/james-project/blob/master/grafana-reporting/MailQueue-1490071879988-dashboard.json[MailQueue] : MailQueue statistics
-
MailboxListener rates : Mailbox events processing rate
-
MailboxListener : Mailbox events processing latencies
-
MessageFastViewProjection : Hit ratio & latencies for the JMAP Message FastView projection
-
Miscalleneous : Collection of various metrics not included in other boards.
-
PreDeletionHooks : Latencies for PreDeletionHooks. Note that this is relevant if this component is configured.
-
SMTP : SMTP latencies reports
-
SMTP count : Request count for the SMTP protocol
-
SpamAssassin : Latencies for SpamAssassin Spam detection and feedback. Note that this is relevant if this component is configured.
-
Tika : Latencies for Tika text extraction. Note that this is relevant if this component is configured.
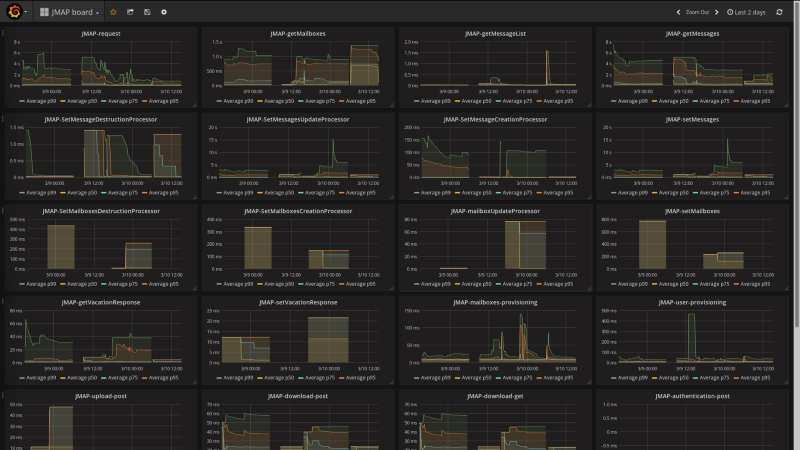
This is for instance how the JMAP dashboard looks like:
Running and configuring Grafana
The following command allow you to run a fresh grafana server :
docker run -i -p 3000:3000 grafana/grafana
Once running, you need to set up an ElasticSearch data-source : - select proxy mode - Select version 2.x of ElasticSearch - make the URL point your ES node - Specify the index name. By default, it should be :
[james-metrics-]YYYY-MM
Import the different dashboards you want.
You then need to enable reporting through ElasticSearch. Modify your James ElasticSearch configuration file accordingly. To help you doing this, you can take a look to elasticsearch.properties.